Corruption Perceptions Index 2018
The results at a glance
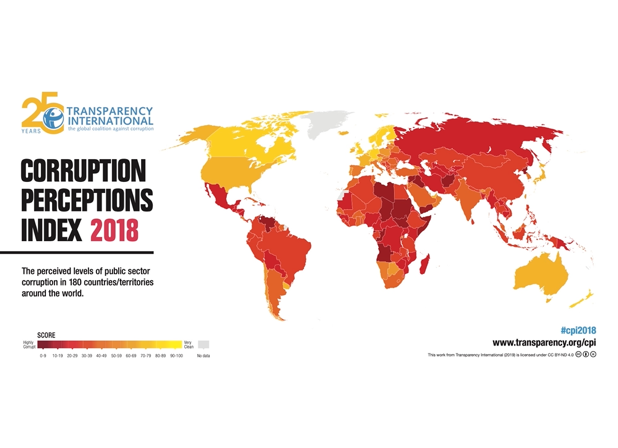
The index, which ranks 180 countries and territories by their perceived levels of public sector corruption according to experts and businesspeople, uses a scale of 0 to 100, where 0 is highly corrupt and 100 is very clean. More than two-thirds of countries score below 50 on this year’s CPI, with an average score of just 43.
It reveals that the continued failure of most countries to significantly control corruption is contributing to a crisis in democracy around the world. While there are exceptions, the data shows that despite some progress, most countries are failing to make serious inroads against corruption.

Trouble at the top: why high-scoring countries aren’t corruption-free
News •
For the third year running, the top seven countries in the Corruption Perceptions Index 2018 consist of the four Nordic nations – Denmark, Finland, Sweden and Norway – plus New…

Conflict at the bottom
News •
As in previous years, many of the countries near the bottom of the 2018 Corruption Perceptions Index have been severely affected by violent conflict in recent years. Why is this…

How corruption weakens democracy
News •
This year’s Corruption Perceptions Index shows a disturbing link between corruption and the health of democracies. Countries with higher rates of corruption also have weaker…
What is happening in the regions of the world?

Middle East & North Africa: corruption continues as institutions and political rights weaken

Tackling the crisis of democracy, promoting rule of law and fighting corruption

Eastern Europe & Central Asia: weak checks and balances threaten anti-corruption efforts

Asia Pacific: little to no progress on anti-corruption

Sub-Saharan Africa: undemocratic regimes undermine anti-corruption efforts

Americas: weakening democracy and rise in populism hinder anti-corruption efforts
Graphics to use and share


The CPI Explained
The index, which ranks 180 countries and territories by their perceived levels of public sector corruption according to experts and businesspeople, uses a scale of 0 to 100, where 0 is highly corrupt and 100 is very clean. More than two-thirds of countries score below 50 on this year’s CPI, with an average score of just 43.
It reveals that the continued failure of most countries to significantly control corruption is contributing to a crisis in democracy around the world. While there are exceptions, the data shows that despite some progress, most countries are failing to make serious inroads against corruption.
