Corruption Perceptions Index 2016
The results at a glance
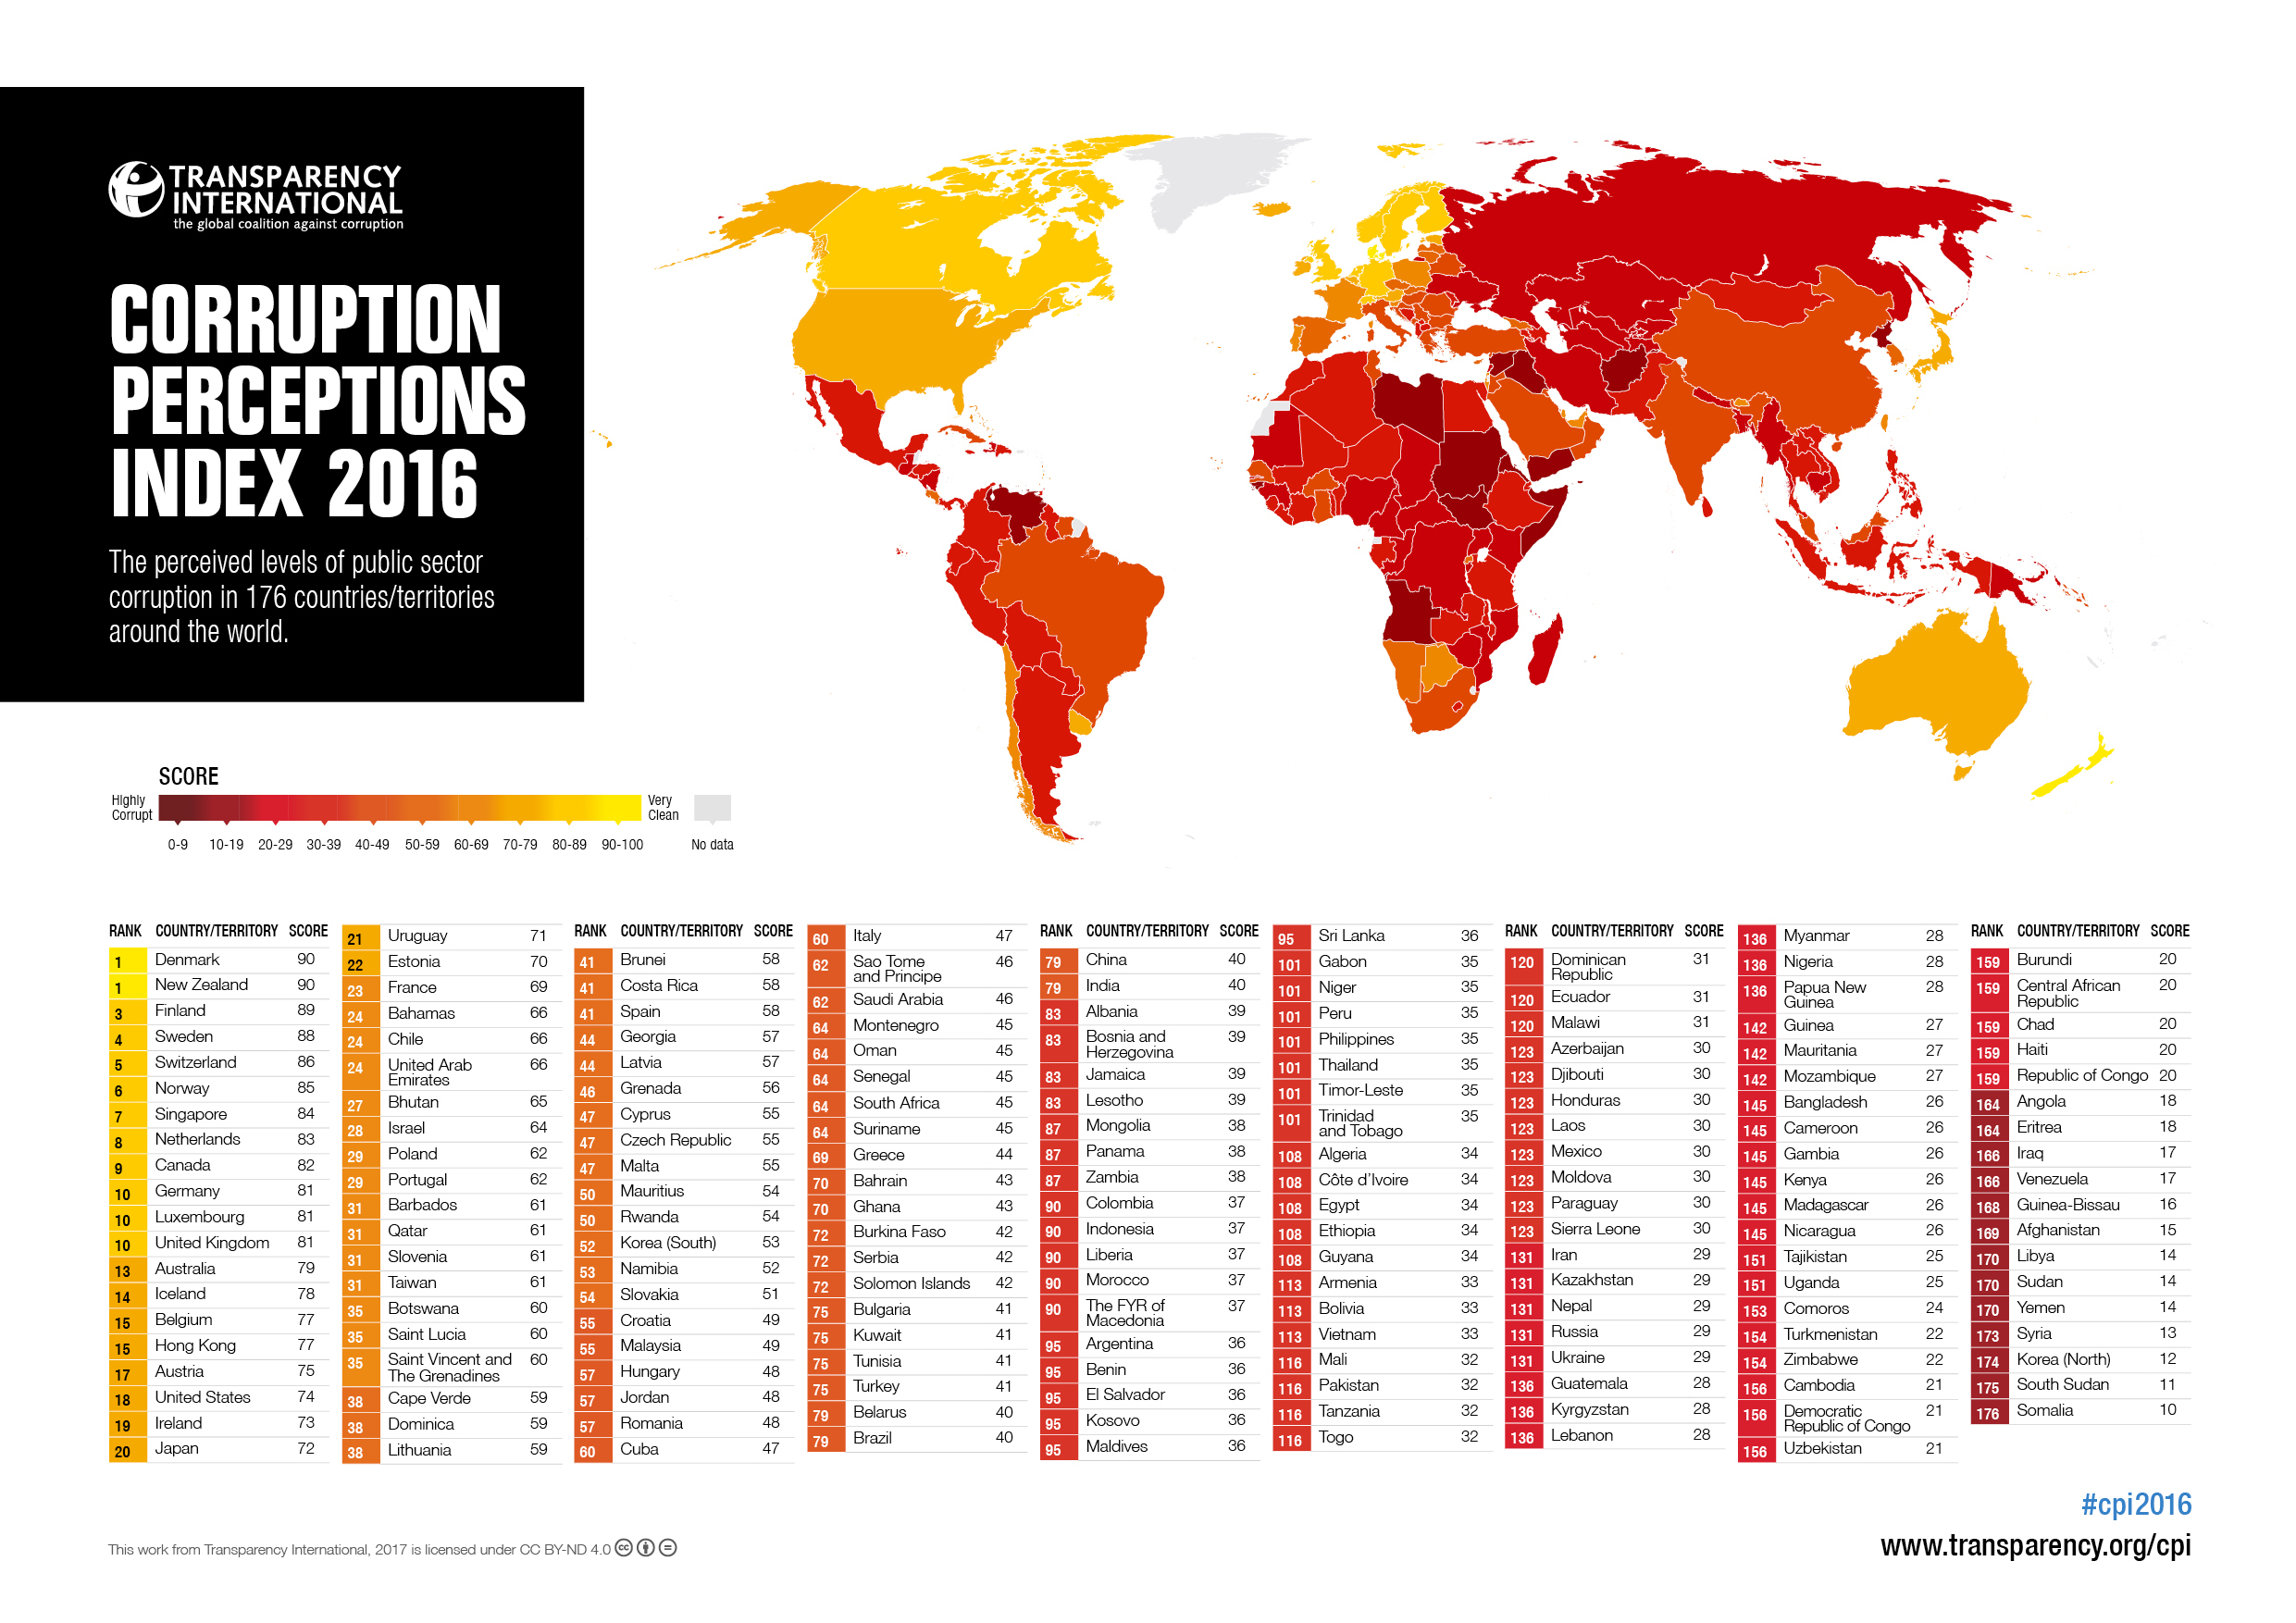
Let's get straight to the point: No country gets close to a perfect score in the Corruption Perceptions Index 2016.
Over two-thirds of the 176 countries and territories in this year's index fall below the midpoint of our scale of 0 (highly corrupt) to 100 (very clean). The global average score is a paltry 43, indicating endemic corruption in a country's public sector. Top-scoring countries (yellow in the map below) are far outnumbered by orange and red countries where citizens face the tangible impact of corruption on a daily basis.
This year’s results highlight the connection between corruption and inequality, which feed off each other to create a vicious circle between corruption, unequal distribution of power in society, and unequal distribution of wealth.
The interplay of corruption and inequality also feeds populism. When traditional politicians fail to tackle corruption, people grow cynical. Increasingly, people are turning to populist leaders who promise to break the cycle of corruption and privilege. Yet this is likely to exacerbate – rather than resolve – the tensions that fed the populist surge in the first place. (Read moreabout the linkages between corruption, inequality and populism.)
More countries declined than improved in this year's results, showing the urgent need for committed action to thwart corruption.

Corruption and inequality: how populists mislead people
News •
Corruption and social inequality are indeed closely related and provide a source for popular discontent. Yet, the track record of populist leaders in tackling this problem is…

Americas: Sometimes bad news is good news
News •
It is not always bad to have headlines about corruption. From the Panama Papers in April to the record US$3.5 billion Odebrecht settlement in Brazil in December, 2016 was a good…

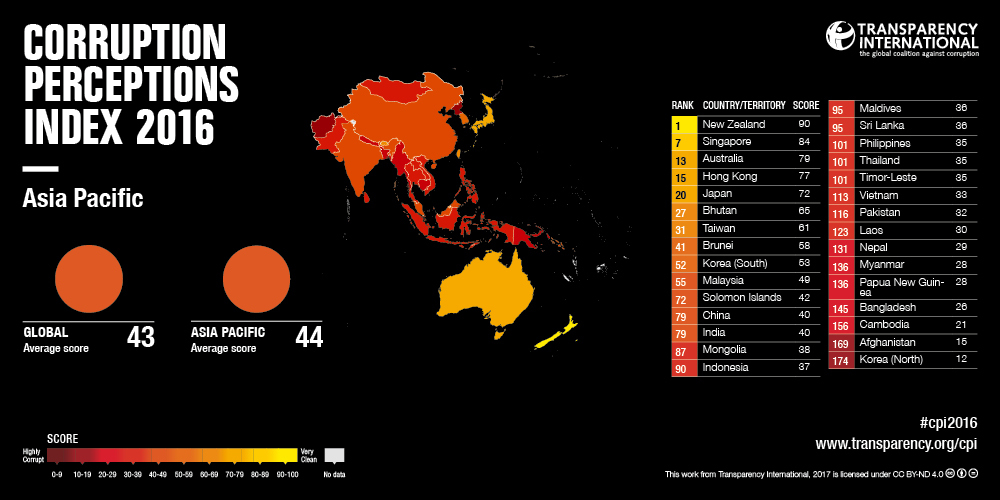
Asia Pacific: Fighting corruption is side-lined
News •
The majority of Asia Pacific countries sit in the bottom half of the Corruption Perceptions Index 2016. 19 out of 30 countries in the region scored 40 or less out of 100.
Putting The Scores In Context
The lower-ranked countries in our index are plagued by untrustworthy and badly functioning public institutions like the police and judiciary. Even where anti-corruption laws are on the books, in practice they're often skirted or ignored. People frequently face situations of bribery and extortion, rely on basic services that have been undermined by the misappropriation of funds, and confront official indifference when seeking redress from authorities that are on the take.
Grand corruption thrives in such settings. Cases like Petrobras and Odebrecht in Brazil or the saga of ex-President Viktor Yanukovych in Ukraine show how collusion between businesses and politicians siphons off billions of dollars in revenue from national economies, benefitting the few at the expense of the many. This kind of systemic grand corruption violates human rights, prevents sustainable development and fuels social exclusion.
Higher-ranked countries tend to have higher degrees of press freedom, access to information about public expenditure, stronger standards of integrity for public officials, and independent judicial systems. But high-scoring countries can't afford to be complacent, either. While the most obvious forms of corruption may not scar citizens' daily lives in all these places, the higher-ranked countries are not immune to closed-door deals, conflicts of interest, illicit finance, and patchy law enforcement that can distort public policy and exacerbate corruption at home and abroad.
Errata
Due to errors in the 2014 and 2015 CPIs some content has been amended in the 2016 CPI web section. This has not changed the results.
The source description document has also been updated to clarify the underlying questions asked by the CPI sources and how this data is used in the CPI calculations.
What is happening in the regions of the world?


Graphics to use and share

The CPI Explained
Let's get straight to the point: No country gets close to a perfect score in the Corruption Perceptions Index 2016.
Over two-thirds of the 176 countries and territories in this year's index fall below the midpoint of our scale of 0 (highly corrupt) to 100 (very clean). The global average score is a paltry 43, indicating endemic corruption in a country's public sector. Top-scoring countries (yellow in the map below) are far outnumbered by orange and red countries where citizens face the tangible impact of corruption on a daily basis.
This year’s results highlight the connection between corruption and inequality, which feed off each other to create a vicious circle between corruption, unequal distribution of power in society, and unequal distribution of wealth.
